 BIDU
BIDUSunday, April 12, 2009
04/12 Price Studies for next week - ETFs
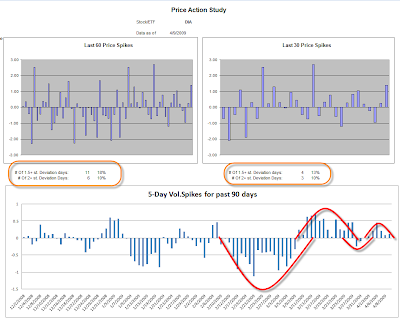
I'm selecting trading candidates for next week. My first step is to go through my list of ETFs and Indexes and run my price study to check how they are behaving in the past few days. This study goes over how many days with over 1.5 and 2.0 st. deviation,
I also look at the 5-Day volatility movement chart, that chart tells me how many st. deviation has the stock moved for a 5-Day period. This allows me to see if there is a the stock is in a channel or trending cycle, and how large the 5-day periods are tells me how strong those moves are.
Bellow is a collection of charts:
-OEX
 SPX
SPX
I also look at the 5-Day volatility movement chart, that chart tells me how many st. deviation has the stock moved for a 5-Day period. This allows me to see if there is a the stock is in a channel or trending cycle, and how large the 5-day periods are tells me how strong those moves are.
Bellow is a collection of charts:
-OEX
 SPX
SPX
Subscribe to:
Posts (Atom)


