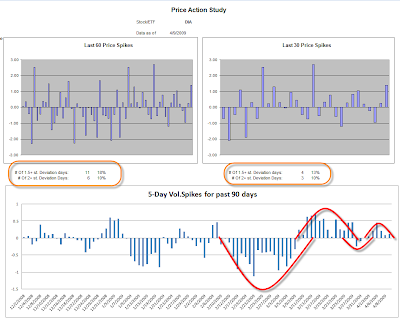
I also look at the 5-Day volatility movement chart, that chart tells me how many st. deviation has the stock moved for a 5-Day period. This allows me to see if there is a the stock is in a channel or trending cycle, and how large the 5-day periods are tells me how strong those moves are.
Bellow is a collection of charts:
-OEX
 SPX
SPX


No comments:
Post a Comment